Sinus Node and Atrial Depolarization
The start of the cardiac cycle
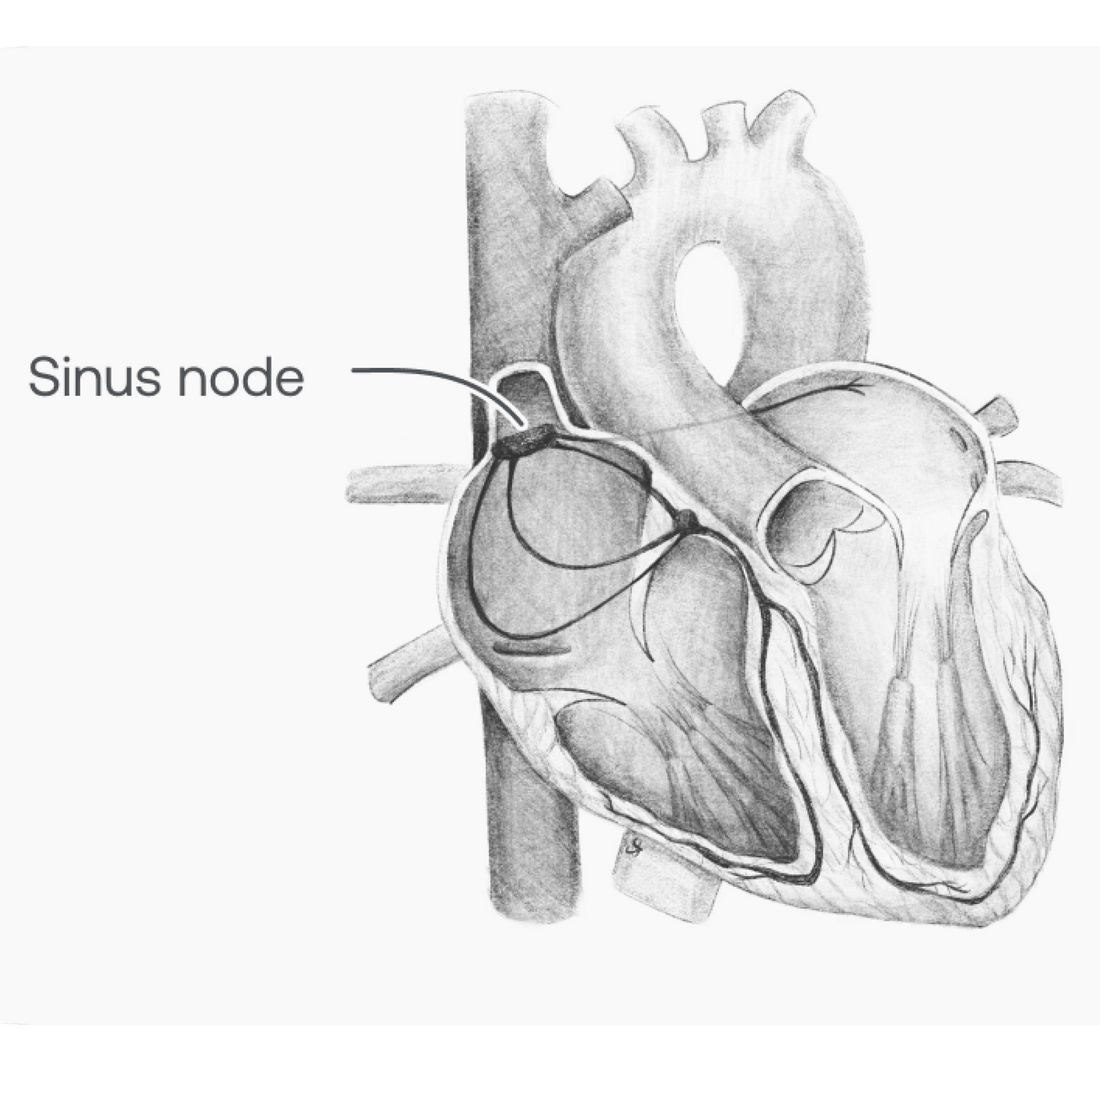
The sinus node is a horseshoe-shaped collection of specialized cells found at the superoanterior junction of the superior vena cava and the right atrium. Every cardiac cycle (heartbeat) begins with the sinus node sending an electrical signal across both atria through specialized conduction tracts, which causes the atrial muscle to depolarize and contract. The P wave appears on the surface ECG, and blood is actively propelled into the ventricles through the open AV valves.

Normal audio
The opening of the atrioventricular valves and movement of blood is normally silent.
S4
The opening of the atrioventricular valves and subsequent transfer of blood from the atria to the ventricles is normally silent. A fourth heart sound, also known as S4, heard during this time period is a marker of diastolic heart failure. S4 is thought to be caused by the vibrations produced when a wave of propelled atrial blood strikes abnormally stiff left ventricular walls. S4 appears just before S1 and is heard loudest at the apex auscultation position.

P wave
The electrical signal sent by the sinus node and resulting depolarization of the atria is recorded by the P wave in an ECG. The P wave in Lead II is an upright half-circle with a normal duration up to 120 msec and height up to 2.5 mm. It is usually of largest amplitude in Lead II. Atrial repolarization is so small in magnitude that it generally is not visible in the ECG.

Peaked P wave
Peaked P waves are abnormally tall. Lead II peaked P waves have a height greater than 2.5 mm and typically indicate enlargement of the right atrium. Lead II peaked P waves have a duration within normal P wave limits (up to 120 msec).
Prolonged P Wave

Prolonged P wave
Lead II P waves that have normal height (less than 2.5 mm) but are abnormally wide (longer than 120 msec) can suggest left atrial enlargement. These p waves may include a deep notch that divides the P wave into two peaks.
Medical Advice Disclaimer
DISCLAIMER: THE CONTENT SET FORTH HEREIN DOES NOT PROVIDE MEDICAL ADVICE NOR IS AN ATTEMPT TO PRACTICE MEDICINE
The information, including but not limited to, text, graphics, images, and other material contained on this website are for informational purposes only. No material on this website or document are intended to be a substitute for professional medical education, advice, diagnosis, or treatment.