Why Phonocardiograms (PCG) Are Valuable
Much like Cinderella, the phonocardiogram (PCG) was ignored for many years and overshadowed by its step-sisters, the echocardiogram and the electrocardiogram. However, one day, a fairy godmother (the digital stethoscope) noticed the PCG lying underutilized and transformed the PCG into a beautiful (and effective) diagnostic tool that stood out from all of the available tools on the market (like its step-sisters). The PCG's quality and fidelity attracted a handsome clinician's attention and soon the PCG became the diagnostic princess in the medical world that frequently adorned her vast array of available information to the medical community. Here's the rest of the story of how PCG came to be, and why it's so beautiful and valuable.
Fundamentals: What is a sound waveform?
A sound waveform is a 2-dimensional plot of sound intensity (or loudness) versus time. It shows the intensity of a sound on the vertical (Y) axis and elapsed time on the horizontal (X) axis. A larger deflection magnitude indicates a louder sound, and a smaller deflection indicates a softer sound. Usually, the units on the Y-axis are arbitrary, although sometimes they may be measurements of loudness such as decibels. The units on the X-axis are usually seconds.
By examining the sound waveform, the duration of the sound can be determined as the time over which the waveform is non-zero, that is, of the baseline; this is silence. It should be noted that a sound waveform does not show specific frequencies contained in the sound, nor which frequencies are present; it only shows intensity or loudness (sometimes called "power") over time.

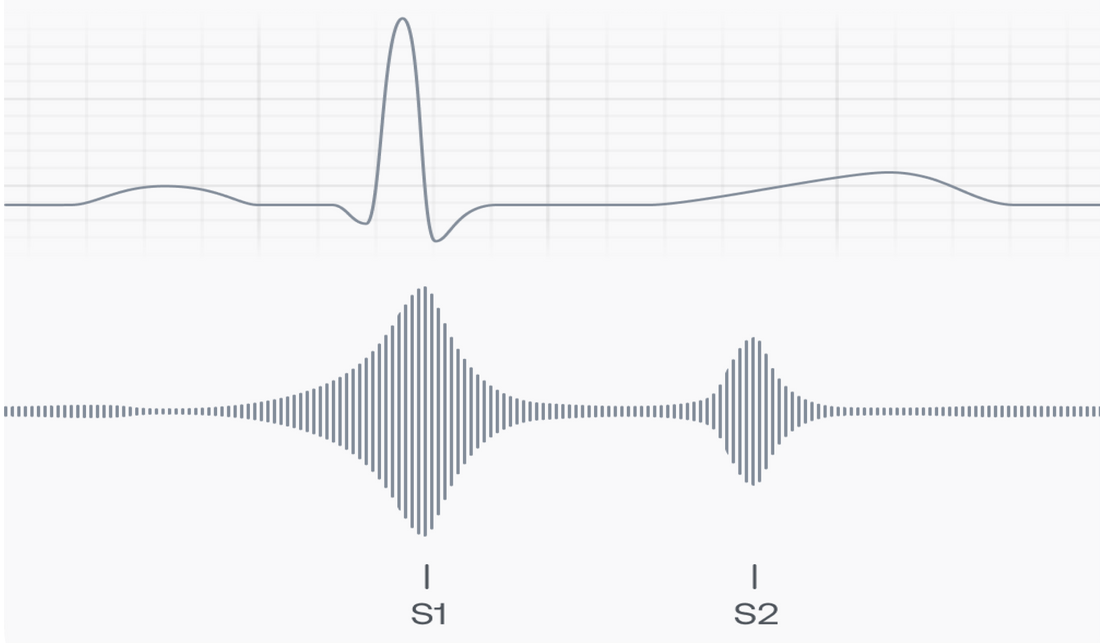
A phonocardiogram (PCG) is a special sound waveform that plots in high fidelity the intensity of heart sounds over time. The two fundamental heart sounds, called "S1" and "S2", are shown on a PCG as large magnitude deflections occurring one after the other, with S1 first. They correspond to the "lub" and "dub" people hear through a stethoscope. Depending upon where on the body the sounds were captured, the S1 deflection may be larger, S2 may be larger, or the sounds may be the same size (loudness). At other times the heart is silent, and so the PCG will be flat, without deflection, resting at the baseline.

Certain heart conditions are associated with additional, abnormal heart sounds. For example, a third heart sound ("S3") and a fourth heart sound ("S4") are associated with acute, decompensated heart failure. Other sounds that appear where they should not include "murmurs", "clicks", and "rubs". Being able to describe the loudest location of the extra sound, along with its timing and quality, are all important in helping the clinician make the correct diagnosis.
The stethoscope has been the essential technology for listening to ("auscultating") heart sounds for almost 200 years, and it is till the standard device in use. Until recently, the only method used to interpret heart sounds was to use a trained ear, listening carefully and closely to the raw, analog sound. But more recent efforts employing mathematical analysis of the digitized PCG have achieved impressive success at identifying S1, S2, and some other, abnormal heart sounds. (Bulgrin et al., 1993).
Background: The history of the PCG
The phonocardiogram originated from Robert Hooke (1635-1703) who is credited with developing the idea, but equipment for the phonocardiogram was not developed until the 1930s. Standardization began in 1950, and the phonocardiogram system was thereafter used on one of the Project Gemini space flights, NASA's second human spaceflight program, to monitor the heartbeats of astronauts.
Phonocardiography originated as an attempt to time the occurrence of heart sounds in the cardiac cycle in relation to the mechanical activity of the heart, as recorded in the apex beat or in arterial pulsations. The method evolved from an era when the observer manually inserted a signal representing the pulse tracing at the time the heart sounds were heard. Over time, many methods were tried, including mechanical synchronous recording, then an electric signal produced by a telephone pickup which stimulated a frog muscle to contract, then by direct recording through a capillary electrometer, or string galvanometer, and finally by electron tube amplification. Low-inertia capsules and mirrors with photographic recording were also used, as well as other ingenious variations. Present-day, the phonocardiogram has developed mainly through improved instrumentation with low-noise level, solid-state amplifiers, more sophisticated electronic filters, and digitization.
However, the phonocardiogram never achieved wide use in diagnostics due to other rapid improvements in imaging techniques. The dynamic visualization of heart structures such as the opening and closing of the aortic and mitral valves is achieved routinely using different ultrasound modalities such as M-mode, Doppler flow imaging, tissue Doppler Imaging (TDI), and speckle tracking. Although these methods yield impressive detail and permit sophisticated analysis, they are time-consuming, expensive, of limited availability, and require a trained sonographer to obtain accurate cardiac images. As such, there is growing interest in the search for alternatives that are simpler, cheaper, and more widely available to capture and study cardiac sounds, measure cardiac activity intervals, and support diagnoses.
Phonocardiogram (PCG), impedance cardiography (ICG) and seismocardiography (SCG) have been extensively used for this purpose (Figure 1), and the non-invasive nature of these technologies makes them well-suited for inclusion in wearable solutions (Di Rienzo et al., 2013, 2014; Ruiz et al., 2013; Chen et al., 2015). This means that heart sound auscultation by means of a stethoscope, a traditional routine in clinical practice, can now be done electronically by small sensors (microphones) with simplicity, speed, and low cost. Combined with digitization, the PCG can now be analyzed electronically, giving it a very high diagnostic value, in particular in the case of valvular and vascular diseases. Digital PCGs open up many possibilities by enabling the usage of signal processing and data analysis techniques to obtain a quantitative understanding of the heart sounds [2,6].
Back to basics: How to interpret and use the PCG
During the cardiac cycle, the heart contracts and relaxes, and heart valves open and close. Starting with the heart in diastole (relaxed), the "AV valves" connecting the upper chambers (atria) to the lower chambers (ventricles) are open. The "semilunar valves" connecting the ventricles to the pulmonary artery and the aorta are closed. Blood flows forward passively through the open AV valves from the body to the right atrium and right ventricle, and the lungs to the left atrium and ventricle. The closed semilunar valves prevent backward flow from the arteries to the ventricles.
Diastole ends and systole begins with atrial activation and contraction. The atrial contraction ejects more blood into the ventricles, and after about 100 msec the ventricle also starts to contract. The rising pressure in the ventricles closes the AV valves, which creates the first heart sound (S1). In normal circumstances, the right-sided (tricuspid) AV valve and the left-sided (mitral) AV valve close at virtually the same time, so S1 is a single sound. On the PCG, S1 appears as a single, large deflection with a rapid onset and rapid decay back to silence (see below). In some pathological states, one AV valve may close before the other, creating a "split S1." In the case of right bundle branch block, for example, right ventricular activation is delayed and so the mitral valve closes slightly before the tricuspid; each valve's sounds are now heard separately. On the PCG this would appear as two distinct peaks with a small separation between them; the relative height of the peaks would indicate the position of the recording sensor in relation to the location of the two valves. Once the AV valves are closed, the heart is again silent.


Later in the cardiac cycle during ventricular contraction, when ventricular pressure exceeds arterial pressure, the semilunar valves open and the heart empties. Normally, this is silent because blood flow is smooth (laminar). But if there is valvular pathology, such as obstruction (stenosis) of the aortic valve, the resulting turbulence will create sound. The sound of aortic stenosis is heard throughout the time of ejection (systole); the sound's qualities vary by degree of disease.


After contraction, the heart starts to relax, and ventricular pressure falls. When ventricular pressure drops below arterial pressure, the semilunar valves close. This is heard as "S2."
It is normal for S2 to "split " in time with the respiratory cycle. At the end of expiration, the aortic and pulmonic valve sounds (A2 and P2) are synchronous. During inspiration, the pressure inside the chest falls. As the lungs expand, so does the pulmonary artery. This increase in capacitance in the pulmonary artery delays closure of the pulmonic valve, and P2 is now heard after A2; S2 has "split" by 20-30 milliseconds. This delay can be seen on the PCG, and if normal splitting does not occur with respiration, then various conditions such as pulmonary hypertension and left bundle branch block can be considered.


Although this all appears quite straightforward, and any observer can intuit the PCG's value, the PCG does have its issues and challenges. The biggest problem for PCG are artifacts that affect the accuracy of both analog (human) as well as digital (computer) sound interpretation. These artifacts have myriad causes, which make mitigating them challenging. They come from the sensor that is used to capture the sound (e.g., the microphone), ambient noise, speech, sensor movement, breathing, chest movement, and coughs and intestinal noises.1 These artifacts are slowly and steadily being overcome through advancements in signal processing and filtering, but they are not all gone just yet.
The clinical value of PCG
The PCG brings value to the clinician in several ways. Through electronic amplification and active noise cancellation provided by digital stethoscopes, the PCG can detect more sounds at softer levels than the human ear. PCG tracing allows the physician to visually group sounds much more easily and with less training than if they were just using their ear. Once S1 and S2 are identified, abnormal sounds such as murmurs, splits, and gallops can then be put into their correct positions in the cardiac cycle.
These technical values actually parallel the value brought by the Electrocardiogram (ECG), which most of us now take for granted:
- The PCG is a durable record of a patient's heart sounds over several cardiac cycles.
- It can be reviewed as many times as needed, without requiring the patient's presence.
- Its amplitudes, intervals, and durations can be measured with precision.
- Changes from beat to beat and over time can be identified and described and diagnoses can be formulated.
- The PCG is objective; because it is captured by an electronic sensor, it is not subject to vagaries in the human ear.
- The PCG is a durable, simple, objective, and effective teaching tool.
Even with this value, the most useful way for humans to sense the heart's electrical activity is to record activity on paper, and it is for this reason that the ECG has kept pace with technology. Digitization of the ECG happened decades ago, ECGs now offer potential diagnoses, and mathematical techniques are well advanced in the study of rhythm disturbances. Beyond these advances, not much else seemed necessary and so the PCG became an afterthought, a nice accessory not a necessary one.
Fortunately, things are different today. Advances in solid-state electronics, computer speed and storage, data science, machine learning, and artificial intelligence have all improved the quality and fidelity of the PCG and made the richness of its information available to the medical community.
Medical Advice Disclaimer
DISCLAIMER: THE CONTENT SET FORTH HEREIN DOES NOT PROVIDE MEDICAL ADVICE OR IS AN ATTEMPT TO PRACTICE MEDICINE
The information, including but not limited to, text, graphics, images, and other material contained on this website are for informational purposes only. No material on this website or document are intended to be a substitute for professional medical education, advice, diagnosis, or treatment.